


Tuesday 10th March 2026


Tuesday 10th March 2025
LC: To read, analyse and record information from a range of non -fiction text.
Grammar
Determiners
LC: To know what is the function of a determiner
To identify determiners
To collect a range of determiners
• Determiners include many of the most frequent English words, e.g. the, a, my, this.
• Determiners are used with nouns (this book, my best friend, a new car) and they limit (i.e. determine) the reference of the noun in some way.
• Determiners include: - articles: a/an, the - demonstratives: this/that, these/those - possessives: my/your/his/her/its/our/their - quantifiers: some, any, no, many, much, few, little, both, all, either, each, every, enough.
Determiners determine a noun - they work within a sentence to pin down a noun.
examples:
an apple,
the pencil,
this chair,
these children,
some tigers,
many people.
Determiner Detectives
Copy and underline the determiners:
The Arctic is a place where polar bears reside. These magnificent creatures are under threat due to many changes in the world’s climate. This issue needs to be brought to the attention of some children in KS2.
climate change classroom presentation2021.pdf
/i/video/Anne_Reid/Climate_Change_Action.mp4
Carefully read the information provided in these web links:
Climate Change - What is Climate?
Young People's Trust For the Environment (ypte.org.uk)
National Geographic Kids – What is climate change?
Discussion:
What you have been reading about?
What is climate change?
Task: In your English books, write notes about climate change.
Adapted:
what is climate change powerpoint.pdf
Task: In your English books, write notes about climate change.

10.03.25
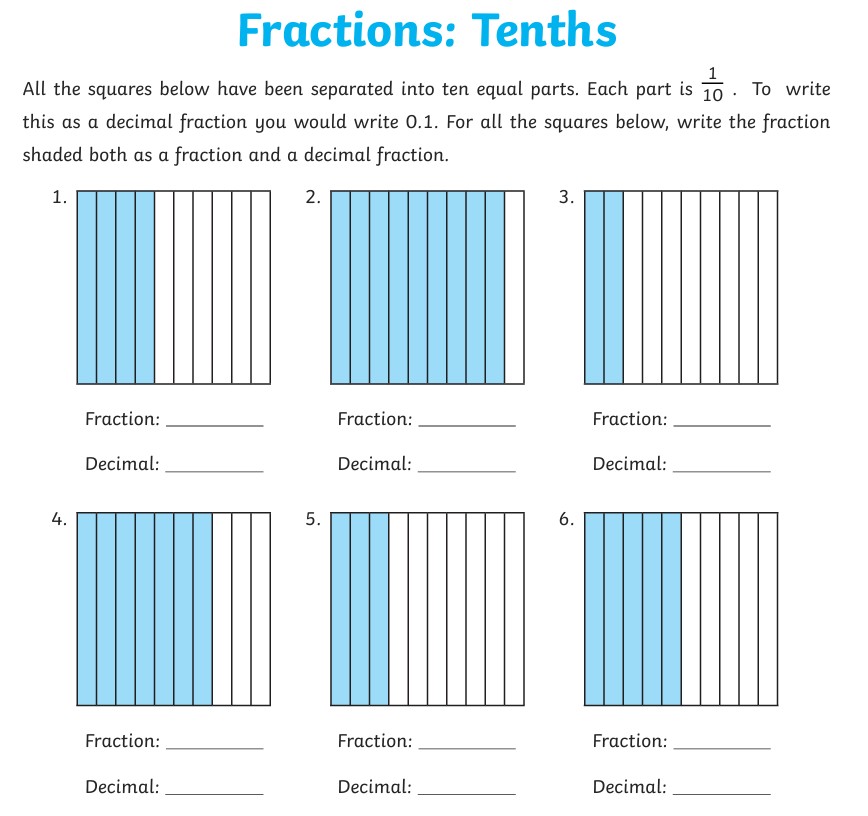
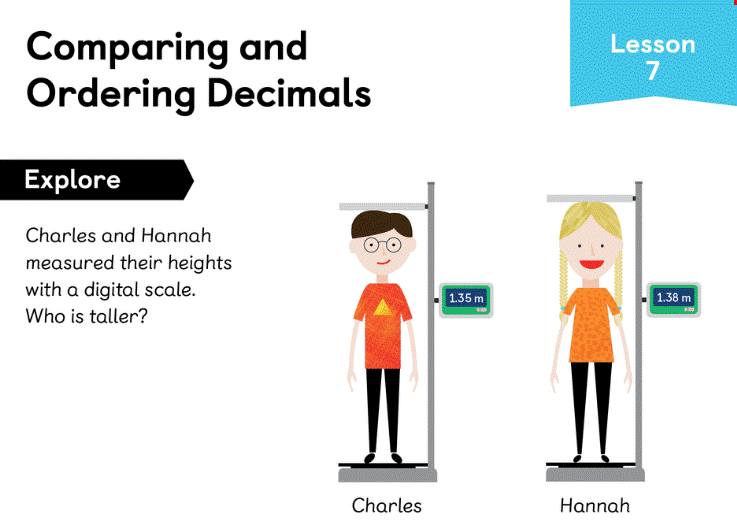
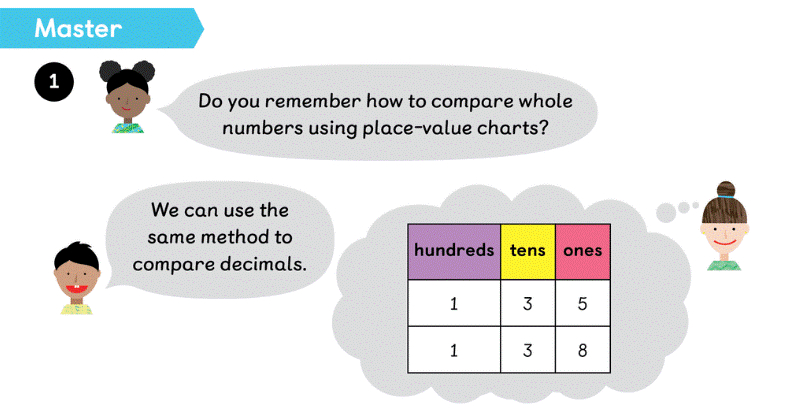
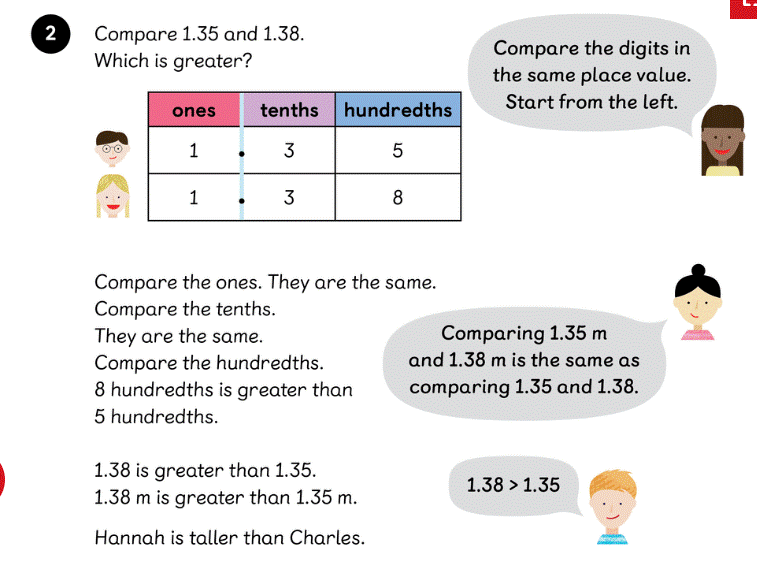
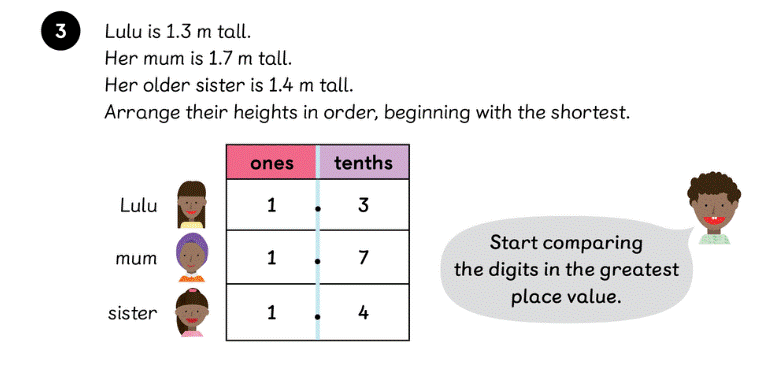
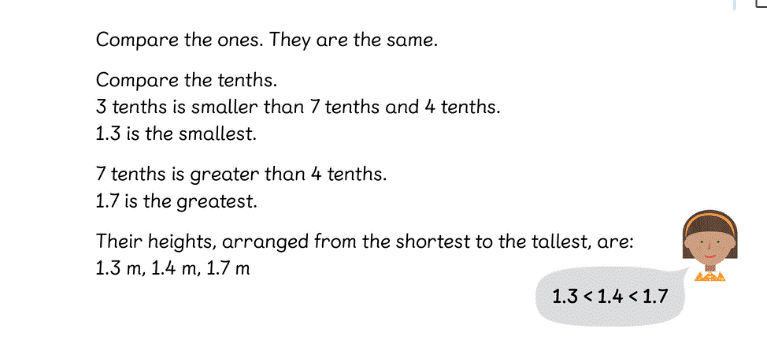
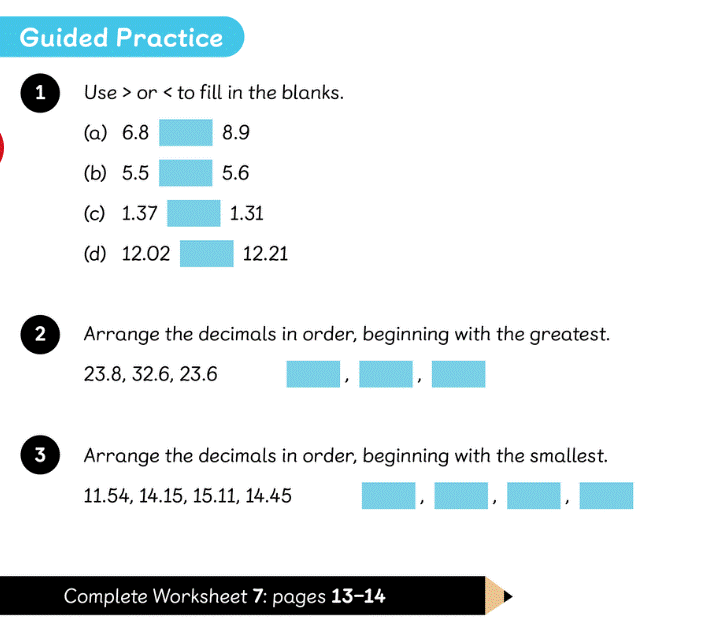
LC- To compare and order decimals.
Adapted
Tuesday 10th March 2026
LC: Present our findings in a graph form.
We recorded the weather in our school grounds every morning and afternoon for a week.
How did we record our findings?
We can record data in lots of different ways.
How is the data being shown on this?
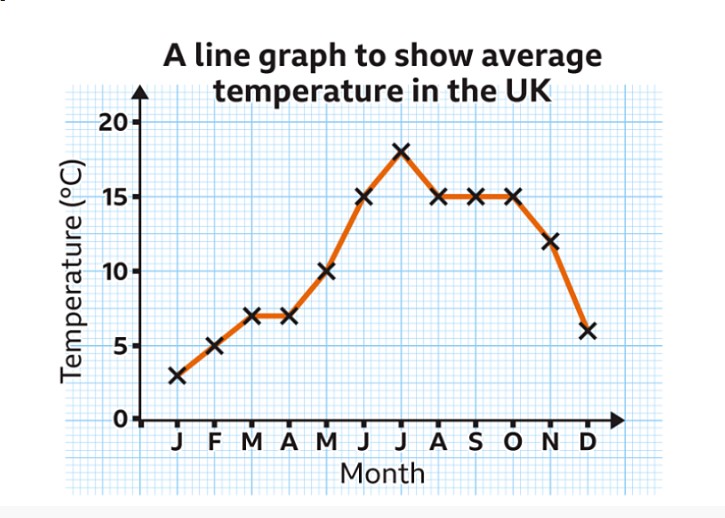 A line graph is a simple way to visually communicate how the measured values of a continuous variable (something that is measured, not counted) change over time.
What does the line graph above show?
We are going to construct our own line graphs to show the temperatures we measured last week.
What will the title be?
What will we label the horizontal axis?
What scale will we use for the horizontal axis?
Complete the line graph by showing the temperatures from your table as a dot in the correct place for each one, then join the dots with lines using a ruler.
![]()
robots primary picture news resource england 9th march.pdf